Catalog year: 2003
In 2003, the global market for metals, investment coins, and bullion was shaped by several significant factors and trends. One of the most notable was the increase in the price of gold. At the beginning of the year, gold traded at around $350 per ounce, but by the end of 2003, it had surpassed the $400 mark. This rise was driven by geopolitical tensions, including the war in Iraq, and the weakening of the US dollar. Investors sought to protect their wealth from inflation and uncertainty by investing in gold coins and bullion.The largest producers of gold continued to be the countries of Africa, including South Africa and Ghana, as well as Australia, Russia, Canada, and China. Gold mining companies such as Barrick Gold and Newmont Mining also played a significant role in the market.
Silver prices fluctuated between $4.50 and $5.50 per ounce in 2003. The price was relatively stable compared to gold, but it tended to gradually increase towards the end of the year. Demand for silver grew from both industry, such as electronics and photography, and from investors.
Platinum traded in the range of $600-$700 per ounce, and palladium traded at $200-$250. Both metals were used in the automotive industry for catalytic converters.South Africa and Russia are the main producers of these metals. Geopolitical events, such as changes in mining legislation and political instability, have affected prices. The development of precious metals futures trading and the emergence of exchange-traded investment funds (ETFs) backed by gold have added a new dimension to the market dynamics. In particular, the launch of the first gold ETF, Gold Bullion Securities, in November 2003 made investments in gold more accessible to a wider audience.
| Metal | Average Closing Price | Year Open | Year Low | Year High | Year Close | Annual % Change |
|---|---|---|---|---|---|---|
| Silver (XAG) | $4.88 | $4.74 | $4.37 | $5.97 | $5.97 | 27.84% |
| Gold (XAU) | $363.83 | $342.2 | $319.75 | $417.25 | $417.25 | 21.74% |
| Palladium (XPD) | $202.38 | $239 | $150 | $273 | $196 | -17.3% |
| Platinum (XPT) | $692.03 | $608 | $603 | $840 | $813 | 35.95% |
* The table shows the average prices for the year based on stock exchange data for 1 ounce of metal.
Price guide:
| # | Name | Series | Images | Price € | Weight | Denomination | Year | Quality | Rating RR |
|---|---|---|---|---|---|---|---|---|---|
| 69 | Year of the Goat | Australian Lunar Calendar I |
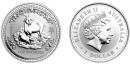
|
104 | 1 oz | 1 Dollar | 2003 | BU | 64 |
| 77 | The American Eagle | The American Eagle |
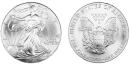
|
52 | 1 oz | 1 Dollar | 2003 | BU | 51 |
| 307 | Australian Nugget | Australian Nugget |
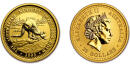
|
978 | 1/4 oz | 25 Dollars | 2003 | BU | 62 |